You can feel when your lead gen is busy but not productive. The Zillow invoice hits. Facebook says the campaign got attention. Your sign calls pulled a few texts. Open house traffic looked decent. Yet when you sit down to figure out what drove closings and commissions, the answer is fuzzy.
That fuzziness is expensive. It makes agents keep paying for channels that create noise, cut channels that were performing effectively, and argue over marketing based on anecdotes. In a real estate business, lead generation metrics aren't a marketing side project. They're how you connect ad spend, listing promotion, follow-up speed, and lead quality to actual GCI.
The good news is that this isn't complicated once you strip out the jargon. A handful of numbers will tell you whether your listing ads are attracting the right buyers, whether your open houses are producing real opportunities, and whether your follow-up system is helping or hurting your pipeline.
From Ad Spend to Actual GCI
A new agent usually starts in the same place. They buy portal leads, boost a few listing posts, print flyers, maybe run some local Facebook campaigns, then wait for the phone to ring. Activity goes up. Costs go up too. But the path from spend to signed contract stays murky.
The trap is measuring what feels visible instead of what pays. Clicks. Impressions. Likes. Video views. Those numbers can help diagnose a campaign, but they don't answer the only question that matters in a sales business: did this channel produce qualified conversations that moved toward a closing?
Where agents lose money
I've seen teams keep a channel alive because it "gets a lot of traffic" even though the leads never answer, never tour, or never get financing lined up. I've also seen open houses get dismissed as old school when they were producing better conversations than paid digital campaigns because the guests were farther along in their buying process.
If you don't track the handoff from source to lead to appointment to close, every decision turns into guesswork.
Stop asking which ad got the most attention. Ask which source created the most qualified conversations that turned into revenue.
The shift from guessing to operating
Once you start tracking lead generation metrics, your business changes fast. You stop treating all leads like they're equal. You stop judging campaigns on gut feel. You learn that an expensive lead can still be a good lead if it converts, and a cheap lead can wreck your follow-up time if it's low intent.
For agents who want a clean way to think about paid acquisition, this guide to calculating your return on ad spend is useful because it forces the same discipline. Tie spend to attributable revenue, not to vanity numbers.
That mindset is what separates busy agents from agents who can forecast their pipeline.
The 6 Core Metrics Every Agent Must Track
Most lead gen reporting gets bloated. You don't need a dashboard with fifty charts. You need six metrics that tell you whether you're buying attention, generating opportunities, and converting those opportunities into income.
Lead volume and CPL
Lead volume is the raw count of inbound opportunities. In real estate terms, it's the number of people who filled out a form, texted off a sign, RSVP'd for an open house, requested a showing, or replied to a listing campaign. It's the top of the funnel.
Cost per lead (CPL) tells you what it costs to create one of those inquiries. Across industries, the average company generates around 1,877 leads per month, with a typical cost per lead of about $391.8, and landing page visitor-to-lead conversion rates often average between 2% and 5%, according to GetDataBees lead gen benchmarks. Real estate won't mirror those averages exactly, but they give you a baseline for judging whether your own funnel is wildly inefficient.
Lead volume without CPL hides waste. CPL without lead quality hides disappointment.
Visitor-to-lead conversion and lead quality
Visitor-to-lead conversion rate measures how many people who see a page, listing, or offer raise their hand. For an agent, this usually shows whether a listing page, home valuation page, or ad landing page is doing its job.
Lead quality is where many agents fall short. A lead isn't valuable because it exists. It's valuable if it matches the type of client you serve and has real intent. In practice, that means you need a simple scoring system. Timeline, financing readiness, price point, neighborhood fit, and responsiveness usually tell you more than raw volume.
A useful real estate example of this problem shows up in the agent contact gap. If your team generates inquiries but doesn't consistently classify and route them, good leads go cold. This write-up on the real estate agent contact gap is worth reviewing if leads are coming in faster than the team can properly handle them.
Time-to-contact and lead-to-close rate
Time-to-contact measures how quickly someone on your team responds after a lead comes in. Every agent knows the difference between calling while the buyer is still on the listing page versus calling after they've spoken with three other agents. You don't need fancy theory here. Fast, organized follow-up wins.
Lead-to-close rate tells you what percentage of leads become closed transactions. This is the number that filters out low-value channels. A source can look productive at the top of the funnel and still be weak if very few of those leads make it to the closing table.
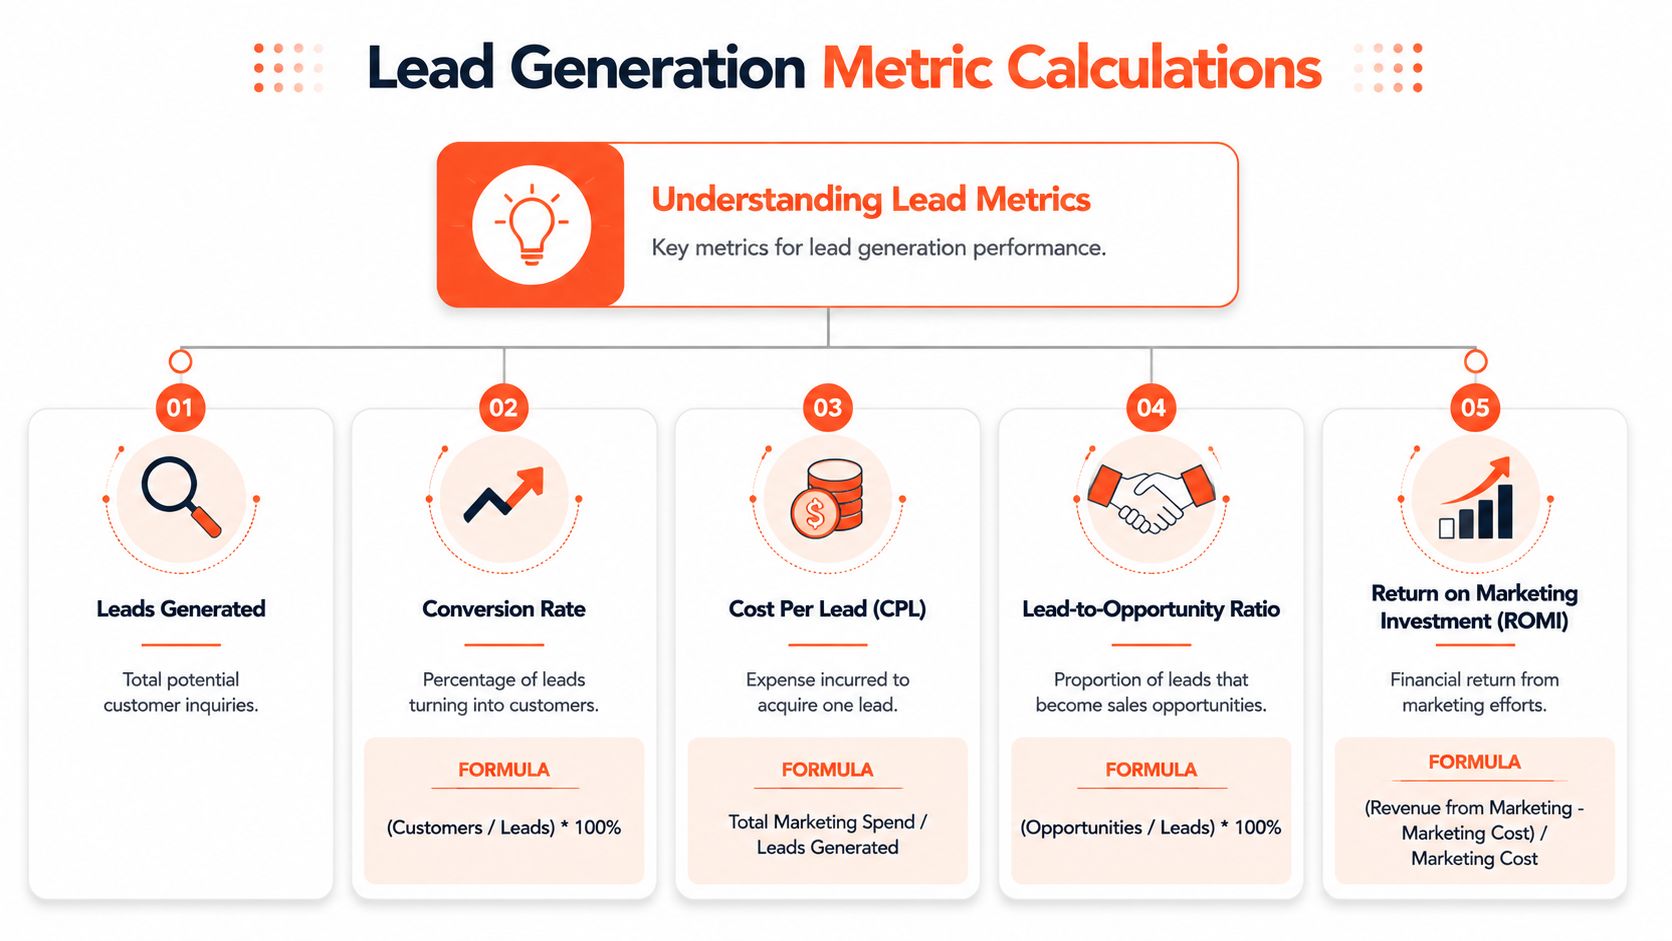
Here is the simple reference table I give new agents.
| Metric | What It Measures | Simple Formula |
|---|---|---|
| Lead Volume | Total new inquiries generated | Count of new leads in a period |
| Cost per Lead | Cost to acquire one lead | Marketing spend / number of leads |
| Visitor-to-Lead Conversion Rate | How well traffic turns into inquiries | Leads / visitors |
| Lead Quality | Fit and intent of each lead | Score based on criteria you define |
| Time-to-Contact | Speed of first follow-up | First response time - lead created time |
| Lead-to-Close Rate | How many leads become deals | Closed transactions / total leads |
Practical rule: If a source has acceptable CPL but poor lead-to-close performance, don't scale it until you've checked lead quality and follow-up speed.
How to Calculate Your Lead Generation Metrics
Definitions are easy. The part that matters is running the math the same way every week.
Use simple formulas first
You don't need a data team to calculate your lead generation metrics. A spreadsheet and a disciplined CRM are enough.
Leads Generated = total number of inquiries in a given period
Cost per Lead = total marketing spend / leads generated
Visitor-to-Lead Conversion Rate = leads / visitors
Lead-to-Close Rate = closed transactions / total leads
For a listing ad campaign, that might look like this in practice. You run paid promotion to a property page, drive traffic to a showing request form, and count how many real inquiries came in. If the spend looks efficient but almost nobody books a tour, the problem isn't just the ad. It may be the page, the offer, or the lead quality.
Real estate examples that make the math useful
An open house gives you a clean operating example. Count attendees, then count how many of those became qualified buyer or seller conversations. That tells you whether the event generated foot traffic or pipeline.
A listing campaign works the same way. Pull these numbers for the campaign window:
- Traffic in from the ad platform or your website analytics
- Leads created in your CRM
- Qualified leads after you review timeline and fit
- Appointments or tours booked
- Closings tied back to the campaign
That sequence matters because a cheap form fill can still be a bad lead. If you only calculate top-of-funnel metrics, you'll overvalue channels that attract curiosity instead of intent.
LVR helps you forecast, not just report
The most useful growth metric for a team lead is Lead Velocity Rate, or LVR. It measures month-over-month growth in qualified leads, not just raw inquiries. According to Warmly's explanation of lead generation metrics, LVR is calculated as ((Qualified leads this month - Qualified leads last month) / Qualified leads last month) × 100, and a consistent 10 to 15% per month is a strong indicator of healthy, scalable growth.
That matters in real estate because raw traffic swings all the time. Qualified demand is what predicts future revenue.
LVR = ((Qualified leads this month - Qualified leads last month) / Qualified leads last month) × 100
Use LVR when you're testing a new listing presentation strategy, a new landing page, or a new creative format. If qualified leads are growing month over month, you may be building real pipeline. If not, you may just be generating more noise.
Setting Up Your Metrics Dashboard
If the numbers live in five places and none of them agree, nobody will trust the reporting. Your dashboard has one job. Show source, speed, quality, and outcome in a way the whole team can act on.

Your CRM is the source of truth
For most agents and teams, the CRM should be the center of the system. Follow Up Boss, kvCORE, Sierra Interactive, and similar platforms can all work if the team uses them consistently. Every lead should enter with a source, timestamp, assigned owner, and status.
If you're relying on inbox searches and text threads, your numbers will drift. That usually leads to two bad outcomes. Good channels get undercounted, and weak channels stay alive because nobody can prove they aren't working.
Analytics and UTMs make attribution usable
Google Analytics shows traffic behavior. UTMs tell you where that traffic came from. Without UTMs, a Facebook ad, a QR code on a property flyer, and a link in an email newsletter can all collapse into messy attribution.
Set up a naming convention and stick with it:
- Source identifies where the click came from, such as Facebook, Instagram, email, or flyer QR.
- Medium identifies the type of traffic, such as paid social, email, or print.
- Campaign identifies the listing, open house, seller lead magnet, or seasonal push.
- Content helps separate creative versions, such as video walkthrough versus static image.
If you want a lightweight way to centralize this outside the CRM, an AI Google Sheets pipeline tracker for real estate can help teams keep source and pipeline data visible without building a complex BI stack.
Don't ignore email deliverability
A lot of agent dashboards miss one quiet failure point. The follow-up emails never reliably reach inboxes. If your nurture sequences are landing in spam, your lead gen metrics will look worse than the channel is.
That's why I like checking a sender setup with the MailGenius email deliverability tool before blaming the campaign itself. It helps confirm whether poor response is a targeting issue, a messaging issue, or a delivery issue.
If attribution is weak, every budget discussion becomes political. Clean tracking turns it back into an operating decision.
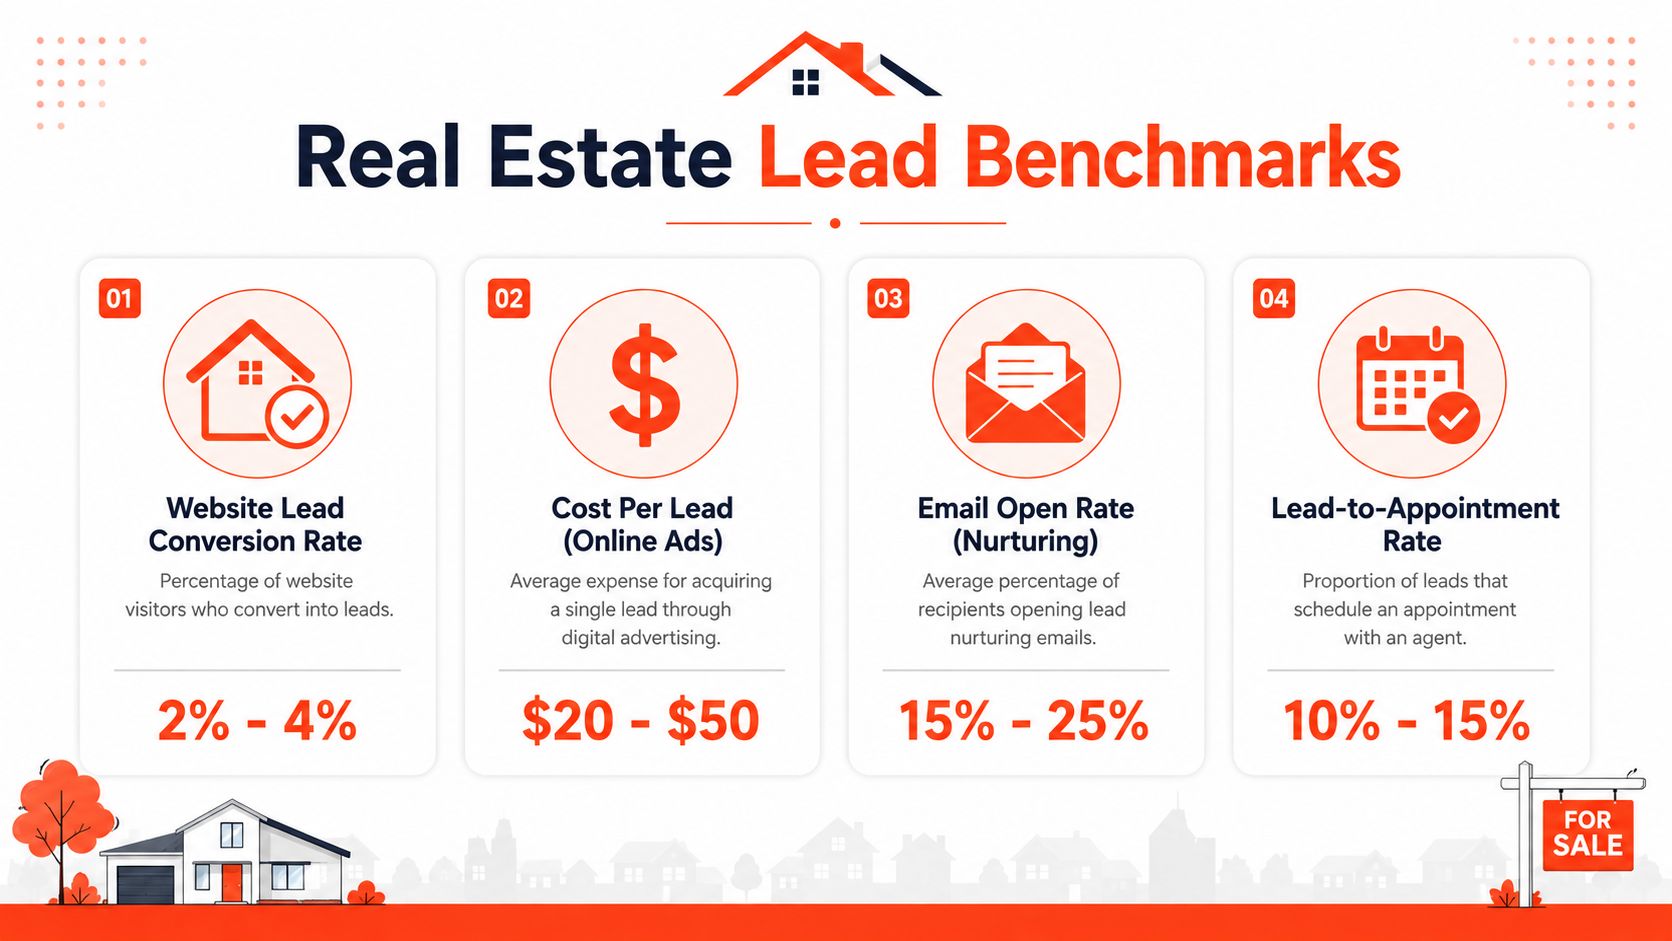
Real Estate Benchmarks What Good Looks Like
Benchmarks matter for one reason. They stop you from overreacting to isolated results. One campaign can spike. One open house can flop. What matters is whether the channel is productive over time and whether its lead quality justifies the effort.
Content benchmarks matter more than channel hype
A lot of agents obsess over platform choice when the bigger variable is content format. According to Keywords Everywhere lead generation statistics, 74% of B2B marketers say video outperforms other content types in driving conversions, and 73% say webinars produce their highest-quality leads. Real estate isn't B2B software, but high-value property transactions do share one important trait with high-consideration B2B deals. Buyers need context, trust, and a reason to move from browsing to conversation.
That makes the benchmark less about "which social platform is hottest" and more about whether your format helps the client understand the property.
For real estate, that usually means:
- Video walkthroughs work well when buyers need spatial context before booking a showing.
- Listing pages with strong visuals and clear next steps tend to convert better than pages that just dump photos and contact info.
- Educational events and webinars can work especially well for seller seminars, investor education, or first-time buyer funnels because they pre-qualify attention.
Good looks different by workflow
An open house should be judged differently from a home valuation funnel. A listing promotion campaign should be judged differently from sphere marketing. That's why broad productivity context helps. If your team wants a more complete operating picture, these real estate agent productivity benchmarks are useful for comparing marketing performance against execution capacity.
Here is the trade-off most agents miss:
- Portal leads can create speed and volume, but they often require stronger filtering and faster response.
- Organic website leads usually take longer to build, but they often come through with better context because the prospect has already spent time with your brand.
- Open houses can produce fewer total names but stronger conversations if the event is positioned and followed up correctly.
- Video-led campaigns often pull better engagement because the prospect can picture the home and the lifestyle more clearly.
A channel isn't good because it's cheap. It's good when your team can convert it efficiently at the quality level your business needs.
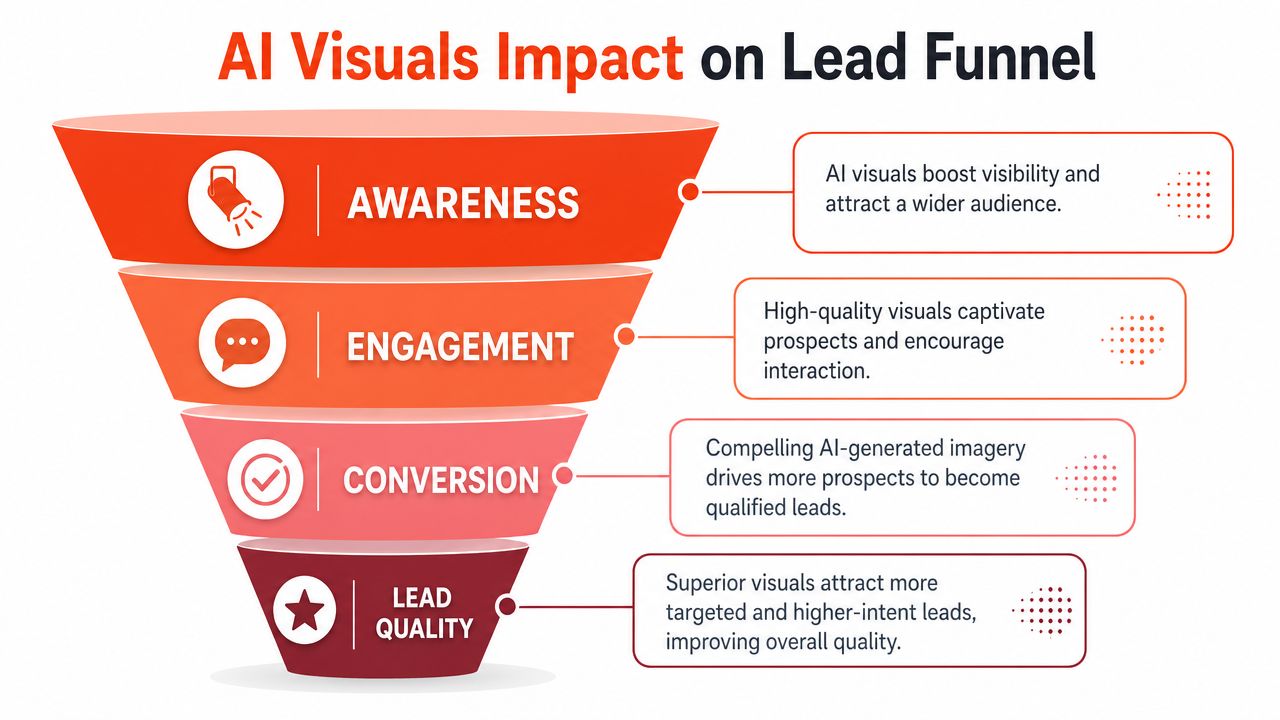
How AI Visuals Drastically Improve Your Metrics
Creative quality affects every step of the funnel. Better visuals don't just make a listing look nicer. They change who clicks, who stays, who inquires, and how serious that inquiry is.
Bad listing visuals distort your metrics
Every agent has seen it. Dark photos. Empty rooms that feel cold. Clutter that distracts from the layout. Inconsistent marketing across MLS, social, and property pages. When the creative is weak, the whole funnel gets noisy.
You may still buy traffic, but lower-intent clicks pile up. Visitors bounce because they can't understand the home's potential. The inquiries you do get are less qualified because the marketing didn't filter for fit. That pushes CPL in the wrong direction and wastes follow-up time on leads that were never strong to begin with.
Better visuals improve both conversion and quality
AI tools have changed the playbook. If you can turn a single video walkthrough into cleaner stills, more polished listing imagery, decluttered rooms, staged concepts, or alternate design looks, you improve the buyer's ability to understand the space before they ever contact you.
That matters because quality isn't just a sales issue. It's a content issue too.
According to Lead Forensics on lead generation metrics, organizations that measure lead quality by source and content format see 20% to 35% higher win rates. That's the practical case for comparing static-photo leads, video-led leads, and AI-enhanced listing leads separately instead of dumping them into one bucket.
A quick example from everyday listing work:
- Empty condo unit gets polite interest but limited urgency.
- The same unit with clean virtual staging and clearer room definition gives buyers a faster mental picture of use and scale.
- A short walkthrough paired with upgraded visuals helps the buyer decide whether the property is worth a tour.
That shift can improve multiple lead generation metrics at once. More qualified clicks. Better page engagement. Better inquiry quality. Less time wasted on people who only clicked because the ad caught their eye without giving them substance.
Here's a useful visual demonstration of how listing creative can change the buyer experience:
How to measure the effect instead of guessing
Don't treat AI visuals as a branding extra. Treat them like a channel variable. Tag the campaign. Separate the listing pages. Compare inquiry quality, showing requests, and conversion by creative type.
Track at least these four fields:
- Creative format such as static, video, virtually staged, or AI-restyled.
- Lead source so you can isolate channel from creative.
- Lead score based on intent and fit.
- Outcome such as no response, conversation, appointment, tour, or close.
If the enhanced creative attracts fewer but better leads, that can still be a win. The metric that matters is not maximum volume. It's profitable volume.
Frequently Asked Questions
How do I track offline leads from an open house or a flyer
Use one intake path per source. For open houses, use a digital sign-in form tied to your CRM and label the source clearly. For flyers, use a QR code that points to a dedicated landing page with UTM tags. If someone texts or calls, train the agent who answers to apply the source label immediately in the CRM.
What's the difference between an MQL and an SQL in real estate
In real estate terms, an MQL is a lead that matches the kind of client you want and has shown meaningful interest. They may have requested info, engaged with a listing, or registered for an event. An SQL is a lead an agent has reviewed and agreed is ready for direct sales follow-up, such as booking a tour, discussing timeline, or talking financing.
The exact definitions matter less than consistency. Your team should use the same criteria every time.
How can I forecast lead volume when testing a new channel or creative format
Formal forecasting models for new content are frequently absent. According to Martal's lead generation KPI guidance, fewer than half of firms have formal models to project lead volume from new content formats, while firms using predictive budgeting report lead-cost reductions of 15% to 25%. A practical starting point is to allocate 10% to 20% of channel spend to a test and work backward from historical engagement rates.
That means you don't go all in on a new listing creative style, ad format, or AI-staged campaign. You carve out a controlled test budget, estimate expected clicks and form fills from your past data, then compare actual lead quality against the baseline.
Which metric should I watch first if I'm short on time
Start with these three: source, time-to-contact, and lead-to-close rate. Those numbers usually reveal the biggest leaks fastest. If leads are coming in but nobody is converting them, you likely have a follow-up or qualification problem, not a top-of-funnel problem.
If you're trying to improve lead generation metrics without adding more manual marketing work, Bounti Labs is worth a look. Bounti helps real estate teams turn a single video walkthrough into property descriptions, stills, MLS-ready photos, and AI-powered decluttering, staging, restyling, or renovation concepts. That gives agents a faster way to produce listing creative that can improve engagement, lead quality, and conversion across the workflows that drive commissions.