
You're probably doing some version of this right now. A seller wants to know what their home is worth, a buyer wants to know whether they should push or wait, or an investor wants a quick read on whether a deal has legs. You open the MLS, pull a few comps, scan active listings, and start assembling numbers.
That's where many agents stop. It's also why many market analyses feel interchangeable.
A strong real estate market analysis isn't a data dump. It's a decision tool. The job isn't to show the client everything you found. The job is to answer the question behind the assignment, then build a clear narrative from evidence. That's what wins listings, calms nervous sellers, sharpens buyer strategy, and makes your pricing advice hold up when the market gets messy.
The old playbook was simple. Pull comps, average prices, print charts, and call it insight. That no longer works well enough. Buyers react differently when rates stay high. Sellers see national headlines and misread local conditions. Investors can't rely on a single rule of thumb and ignore landlord laws, taxes, or operational friction. If your analysis doesn't connect the numbers to behavior, it won't change decisions.
Redefining the Goal of Your Market Analysis
Most weak analyses fail before the first comp is selected. The agent starts with the wrong question.
“What's the market like?” sounds reasonable, but it's too vague to be useful. A seller deciding whether to list this month needs a different analysis than a buyer trying to negotiate on a stale listing. An investor screening rentals needs a different lens than a homeowner deciding whether a renovation will pay back in resale.
Start with the decision, not the data
Before you touch the MLS, define the exact decision at stake.
A seller analysis should answer questions like these:
- Pricing decision: Where is the defensible launch range?
- Timing decision: Should the property hit the market now, or does waiting improve the setup?
- Positioning decision: Which features matter most to buyers in this segment?
A buyer analysis asks something else:
- Comparative pricing: Is this home priced in line with nearby alternatives?
- Negotiation risk: Are you competing against urgency or fatigue?
- Fallback options: What else can this buyer buy at the same payment comfort level?
Investment analysis is different again. That's where generic advice does the most damage.
One industry guide notes that the popular 1% rule is often used as a fast screen, but a more expert-oriented threshold is a 0.6% monthly rent-to-purchase-price ratio as a minimum for positive cash flow, alongside cap rate and cash-on-cash return checks. The same guidance also stresses landlord laws, property taxes, and eviction timelines because those factors can change real returns even when the headline rent-to-value ratio looks fine, as outlined in RealWealth's market analysis guide.
Practical rule: If you can't state the client's decision in one sentence, your real estate market analysis will drift into trivia.
One property, three completely different analyses
Take the same duplex and change the client objective.
| Client objective | Main question | What matters most |
|---|---|---|
| Seller | How do we maximize net without killing momentum? | Comp quality, likely buyer pool, price resistance |
| Buyer | Can we buy below replacement sentiment and still stay protected on value? | Negotiation room, nearby substitutes, condition risk |
| Investor | Will the deal still work after real expenses and local regulation? | Rent-to-price ratio, operating costs, legal friction |
This is why one-size-fits-all reporting falls apart. Agents often use the same template for every assignment, then wonder why the client leaves with more information but less clarity.
What actually works
Use a short intake before you research:
- Define the client's win condition. Highest sale price, fastest sale, lowest risk, strongest cash flow, or best long-term upside.
- Identify essential requirements. Timeline, payment ceiling, renovation tolerance, tenant profile, or tax sensitivity.
- Decide what would change the recommendation. If inventory rises in the subject segment, if buyer competition looks shallow, if expenses break the deal, or if nearby listings reset expectations.
Once the goal is clear, the analysis gets faster. More important, it gets sharper. You stop collecting numbers because they're available and start collecting evidence because it answers something.
Gathering Market Intelligence Not Just Data
The MLS gives you activity. It doesn't always give you reality.
Top agents know the difference between data that's easy to download and intelligence that helps you advise with conviction. If you're only reading solds, actives, and average days on market, you're seeing the market through a narrow lens. You need records, local voices, and property-level pattern recognition.
Use a two-stage workflow
A strong workflow starts broad, then gets local. One practical framework recommends screening candidate markets first with supply-demand and job diversity metrics, then narrowing to submarkets by contacting at least 3 local property management companies and 3 commercial brokers, and validating conclusions with a property-level sample of around 200 properties per market, as described in Janover's real estate market analysis workflow.
That structure matters because citywide averages can hide street-level weakness or opportunity.
Here's a practical version of that process:
- Start with market screening: Look at supply pressure, occupancy patterns, rent direction, and how dependent the local economy is on a narrow set of employers.
- Move to submarket validation: Call operators who deal with tenants, concessions, renewals, and churn. They'll tell you what dashboards miss.
- Then sample properties: Review enough listings, leases, photos, and histories to catch recurring patterns in condition, pricing discipline, and product quality.
Build a source stack that catches bad assumptions
A reliable real estate market analysis usually pulls from three buckets.
MLS and listing history
Use the MLS for solds, pendings, withdrawn listings, expired listings, relists, and price changes. Listing history tells you more than the final number. It reveals whether the market accepted the initial pricing thesis or rejected it.
Public-facing inventory trends can also help you frame the broader setup. If you want context for how supply pressure has been shifting nationally, Bounti's summary of the 2025 U.S. real estate inventory report is useful for grounding the conversation before you narrow to your local market.
Public records and municipal data
Tax records, deeds, permit history, zoning, and assessment data help you verify what the listing says. They also expose hidden issues. An addition without permits, a recent transfer, or zoning constraints can change pricing logic fast.
Local human intelligence
Most agents underinvest in this aspect.
Ask property managers what tenants are resisting right now. Ask brokers which concessions are happening but not being advertised. Ask leasing teams which blocks get foot traffic and which ones look good on paper but don't convert.
Numbers tell you what closed. Operators tell you what almost happened, what failed, and why.
Filter out garbage before it pollutes the story
Not every comp or data point deserves equal weight. Throw out or down-weight properties with obvious condition mismatch, unusual seller motivation, incomplete marketing exposure, or major physical differences the client will never accept as equivalent.
A practical filter looks like this:
- Question suspicious outliers: If one sale is far above or below the cluster, inspect photos, terms, and timing before using it.
- Check freshness: A comp from a different market phase can mislead more than it informs.
- Match the actual competitor set: The subject property doesn't compete with every nearby home. It competes with what a buyer would realistically consider instead.
That's how you stop being a person who reports data and become a person who explains a market.
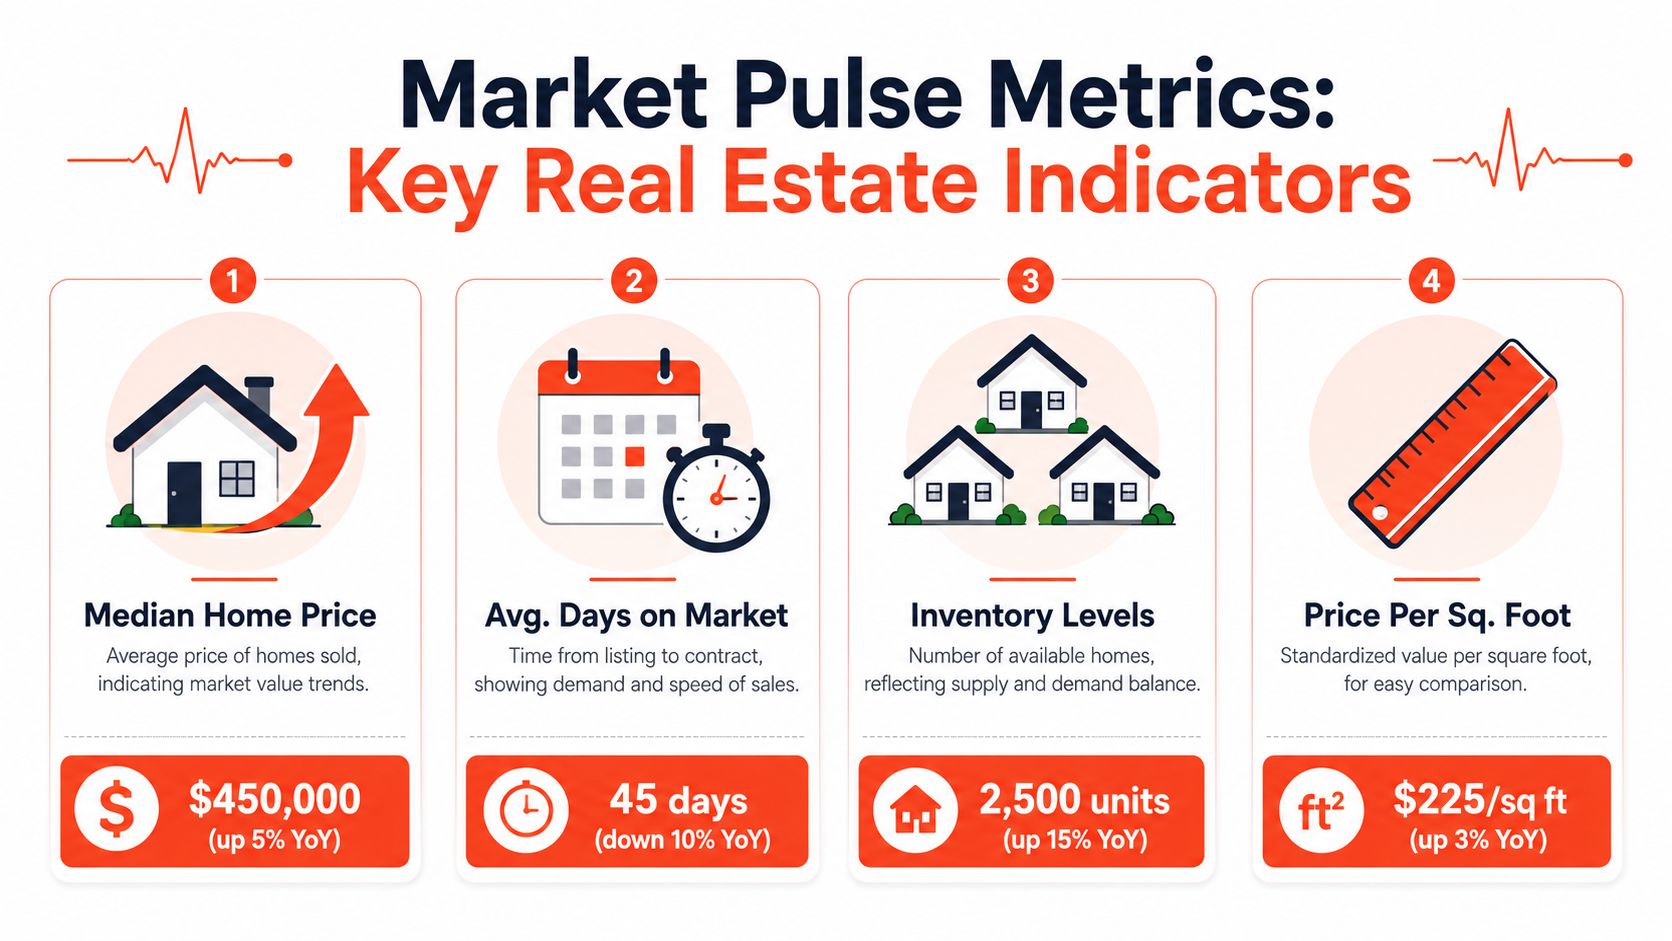
Calculating the Key Market Pulse Metrics
Once the raw material is assembled, you need a handful of metrics that reveal where bargaining power sits. Not dozens. A short set, interpreted correctly, is more useful than a giant dashboard.
A useful reminder comes from national housing data. J.P. Morgan Global Research noted that U.S. existing-home sales in December 2025 rose 5.1% seasonally adjusted to a nearly three-year high, while also projecting national house prices would stall at 0% growth in 2026, according to J.P. Morgan's U.S. housing market outlook. Sales can look healthy even when pricing power is fading. That's why you need underlying metrics, not just headlines.
Read speed before you read price
Absorption rate tells you how quickly available inventory is being consumed. In plain language, it answers one question: how fast is the shelf clearing?
Here's a simplified perspective:
- Higher absorption usually signals stronger demand relative to supply.
- Lower absorption usually means listings have more competition and buyers have more time.
Days on market matters too, but the average can hide the truth. Look at the distribution. Are good homes still moving fast while stale inventory drags the average up? Or is the entire segment slowing together? Those are different markets.
Fast sales at the top of the quality stack don't mean the whole market is hot. They may only mean buyers still pay for the best product.
Watch the spread between asking and getting
The list-price-to-sale-price ratio shows whether sellers are getting close to what they ask. This metric matters because it reflects negotiation pressure more directly than median price alone.
If the ratio is tightening, buyers are pushing back. If it stays firm, sellers still have an advantage, even when properties take longer to move. Pair this with price-change frequency and you'll see whether sellers are adjusting early or defending aspirational pricing too long.
A quick diagnostic table helps:
| Metric | What it signals | What to watch for |
|---|---|---|
| Absorption rate | Pace of market movement | Whether supply is being cleared efficiently |
| Days on market distribution | Where speed is concentrated | Whether slowdown is broad or isolated to weak listings |
| List-to-sale ratio | Negotiation pressure | Whether sellers are conceding quietly |
| Inventory in months | Balance of supply and demand | Whether new competition is building ahead of price changes |
Use inventory and price per square foot carefully
Inventory measured in months is one of the cleanest indicators of market balance. Think of it as runway. More runway means more buyer choice and more pressure on positioning.
Price per square foot helps standardize comparisons, but it's not a valuation shortcut. It's best used to sanity-check comp adjustments, not replace them. A renovated townhome and a dated one on the same block may have similar size and very different buyer reaction.
This is the core discipline. Calculate enough to understand market pulse. Then interpret those numbers in context of product quality, segment, and buyer behavior.
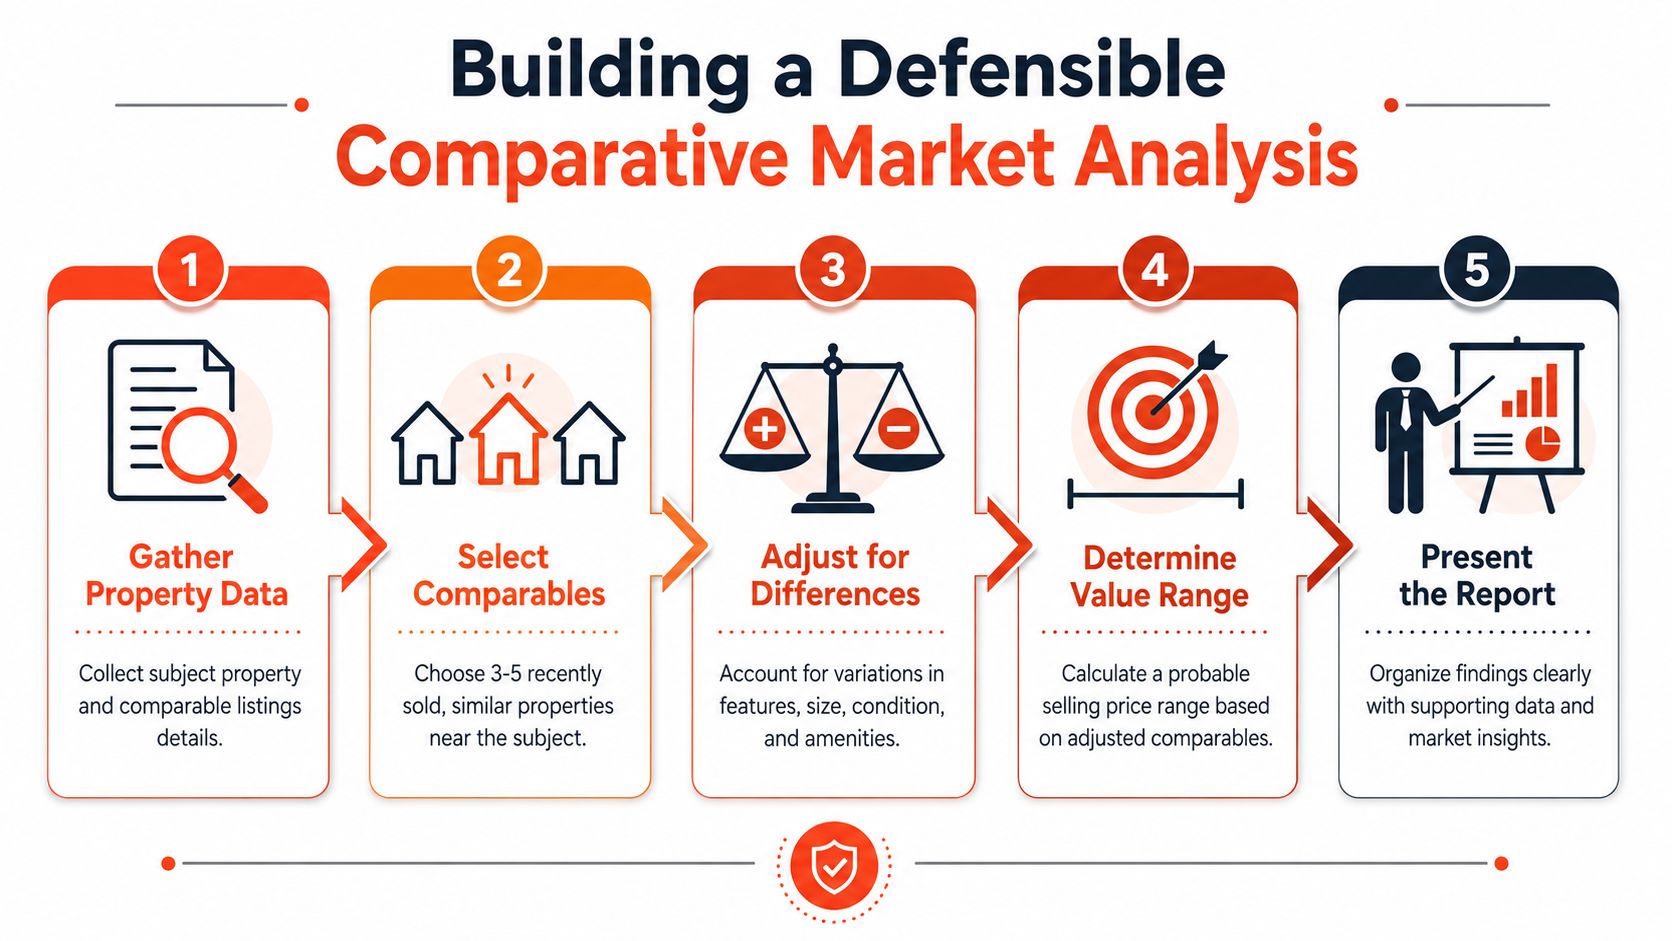
Building a Defensible Comparative Market Analysis
A CMA fails when it looks precise but can't survive basic scrutiny. Sellers challenge it. Buyers poke holes in it. Competing agents dismiss it. The fix isn't more pages. The fix is better logic.
A defensible comparative market analysis does three things well. It selects the right comparables, adjusts for differences without fantasy math, and presents a value range the client can trust.
Choose comps that reflect buyer substitution
Agents lose credibility when they choose comps by radius alone. Buyers don't shop by radius. They shop by substitution.
If the subject is a renovated family home on a quiet street with updated kitchen and bath quality, then the right comp set should reflect what a buyer would consider instead. That might include a property slightly farther away but with a stronger match on layout, lot utility, finish level, school draw, or parking.
Use a hierarchy when selecting comps:
- Start with the same product type. Detached should compete with detached. Condo with condo. Duplex with duplex.
- Then match buyer profile. First-time buyer product, move-up product, downsizer product, or investor product.
- Then match condition and usability. Renovation quality, floor plan function, outdoor space, and noise exposure often matter more than small size differences.
- Only then use proximity as a tiebreaker.
A short comp note beside each property helps. Explain why it belongs in the set. That single sentence often matters more than another spreadsheet column.
Make adjustments that clients can follow
Adjustments should be logical, not theatrical. Don't pretend you can engineer perfect precision from imperfect housing stock.
A useful structure is to adjust in layers:
- First layer is hard differences: bedroom count, bathroom count, garage utility, finished lower level, lot size.
- Second layer is quality: renovation standard, deferred maintenance, curb appeal, natural light.
- Third layer is location nuance: corner exposure, backing conditions, block desirability, walkability, school boundary appeal.
Keep the language plain. “This comp sold higher because its kitchen and bath package will pull a stronger emotional response.” Clients understand that. “We made a market-supported subjective quality adjustment” sounds evasive.
A CMA becomes defensible when another agent can disagree with your adjustment but still respect the reasoning.
Present a range, not a magic number
The market rarely hands you one exact number. It gives you a probable zone.
That range should reflect how the subject would perform under different launch conditions:
| Pricing lane | What it assumes | Likely outcome |
|---|---|---|
| Aggressive entry | Seller wants attention quickly | More activity, less room for overreach |
| Fair market | Property aligns with strongest comp evidence | Best balance of exposure and net protection |
| Aspirational | Seller is testing top-end demand | Higher risk of slower response and later reductions |
Clients usually don't need more certainty. They need honest trade-offs.
That's also where modern tooling helps. If you're looking at ways AI can speed up comp selection, formatting, and presentation, Bounti's overview of AI CMA automation for real estate agents is a practical example of how teams are reducing manual assembly work while keeping human judgment in the loop.
Turn the CMA into a narrative
Don't present a pile of addresses. Present an argument.
A strong delivery sounds like this in substance: these three solds define the likely value floor and center; these two active listings show where seller competition sits today; this pending suggests the upper end of buyer tolerance if presentation is sharp; these condition differences explain why the subject belongs in this part of the range, not that one.
That's what clients remember. Not the volume of comps. The clarity of the conclusion.
Interpreting Trends for Pricing and Marketing Decisions
Many market analyses frequently fall short: The numbers are accurate, but the advice is weak.
The market often sends mixed signals. In May 2025, Realtor.com reported that U.S. unsold home inventory was up 20.8% year over year while the national median list price remained flat, according to Realtor.com's May 2025 housing data. That matters because rising supply doesn't automatically mean immediate headline price declines. Sellers often respond first with discounting, concessions, and more time on market.
Read the sequence of pressure
When inventory rises, many sellers assume prices must fall right away. That's not always how the market behaves.
Pressure often shows up in this order:
- More competing listings appear first
- Buyer response becomes more selective
- Price reductions and concessions increase
- Only later do broader price benchmarks soften
If you advise sellers only off median price, you'll miss the early warning signs. A listing can still be technically “priced in line” and still underperform because buyers now have more choice and less urgency.
Match pricing strategy to the market's actual friction
In a market with heavier inventory and softer response, don't price as if attention is automatic. Your launch has to do more work.
That usually means adjusting three levers together:
- Price: Tight enough to create engagement from the right buyer pool.
- Presentation: Strong visuals, clean feature hierarchy, and no confusion about who the property is for.
- Marketing angle: Affordability, layout utility, rental fallback, lifestyle convenience, or renovation upside, depending on segment.
A good real estate market analysis doesn't stop at value. It tells you which story the listing needs.
If supply is building but pricing hasn't cracked, the listing agent who wins is usually the one who positions the home better, not the one who insists the old strategy still applies.
Give clients advice they can act on
For sellers, that means explaining not just a number, but a plan. If the property launches at the higher end of the range, define the response threshold that would trigger a correction. If the market is selective, set expectations around showings, feedback quality, and the speed of adjustments.
For buyers, explain where negotiation might open without assuming every seller is weak. Some listings are overpriced. Others are better than the nearby alternatives. Your analysis should tell the difference.
For investors, tie pricing advice back to operational reality. A property can look acceptable at purchase and still disappoint if regulation, taxes, management burden, or tenant demand undercut the pro forma.
That's the shift from analyst to advisor. You're not reciting conditions. You're helping the client act inside them.
Accelerate Your Analysis with AI and Visual Tools
Manual market analysis takes time in all the wrong places. Agents spend hours cleaning comp sets, sorting photos, summarizing differences, formatting presentations, and rebuilding the same pricing story for each client. That work is necessary. It just shouldn't all be manual.

AI is useful when it handles pattern-heavy tasks and leaves judgment to the agent. That includes comparing listing language, surfacing recurring property features, organizing comp notes, summarizing public listing history, and turning raw findings into visuals a client can scan quickly.
Use AI where the data is messy
CARTO argues that a more complete real estate market analysis should incorporate inputs like human mobility, traffic, and point-of-interest data, not just traditional listing and census-style sources, as explained in CARTO's guide to modern real estate market analysis data. That's exactly the kind of work AI helps with. It can process unstructured, location-heavy datasets far faster than a person working in spreadsheets.
That matters in commercial leasing, mixed-use projects, and residential submarkets where buyer behavior depends on observed activity patterns, commute convenience, and nearby amenities long before closed-sale data fully reflects the shift.
If you're evaluating broader tooling options, ListingBooster.ai's AI recommendations are a useful reference point for how different platforms fit different agent workflows.
A second practical resource is Bounti's guide to AI for real estate agents in 2026, which covers how agents are using AI across analysis, listing prep, and marketing production.
For teams that want to see the workflow in action, this walkthrough gives a clearer sense of how AI-assisted real estate marketing tools fit into the day-to-day process.
What to automate and what to keep human
Automate the repetitive parts:
- Comp organization: grouping likely comparables and pulling visible differences
- Visual production: listing-ready imagery, decluttering concepts, and alternate presentation styles
- First-draft reporting: turning notes into a client-ready outline
Keep the agent in charge of:
- Final comp selection
- Adjustment logic
- Pricing recommendation
- Client communication
That split works because clients don't hire you to sort files. They hire you to interpret uncertainty and recommend a course of action.
Bounti Labs fits that workflow when you need to turn analysis into presentation quickly. With a single walkthrough, Bounti Labs can generate property descriptions, pull stills, create MLS-ready visuals, and show decluttered, staged, restyled, or renovated versions of a space. That's useful when your market analysis says presentation and positioning will decide whether the property competes well.